 |
BHAC Python tools
|
|
BHAC Python tools
|
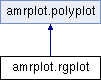
As polyplot, but use regridded data to display. More...
Public Member Functions | |
| def | show (self, var=None, data=None, min=None, max=None, reset=None, fixrange=None, filenameout=None) |
| Draw the plotting-window. More... | |
 Public Member Functions inherited from amrplot.polyplot Public Member Functions inherited from amrplot.polyplot | |
| def | __init__ (self, value, data, nlevels=256, grid=None, blocks=None, blockWidth=8, blockHeight=8, nlevel1=0, cmap='jet', min=None, max=None, xrange=None, yrange=None, orientation='vertical', right=True, fixzoom=None, fixrange=None, fig=None, axis=None, filenameout=None, clear=True, edgecolor='k', smooth=0, swap=0, kwargs) |
| def | setValue (self, value, min=None, max=None) |
| Sets the min and max values of the data to saturate the display. More... | |
| def | update (self, var=None, data=None, min=None, max=None, reset=None, fixrange=None, filenameout=None) |
| Prepare to re-draw the window, check if data was updated. More... | |
| def | info (self) |
| Print info to the console. More... | |
| def | show (self, var=None, data=None, min=None, max=None, reset=None, fixrange=None, filenameout=None) |
| Draw the plotting-window. More... | |
| def | colorbar (self, cax=None) |
| Draw the colorbar. More... | |
| def | save (self, filenameout=None) |
| Save the figure. More... | |
| def | onkey (self, event) |
Public Attributes | |
| viewXrange | |
| viewYrange | |
| ax | |
| fixzoom | |
| valueClip | |
| swap | |
| image | |
| filenameout | |
| Public Attributes inherited from amrplot.polyplot | |
| swap | |
| nlevels | |
| grid | |
| blocks | |
| blockWidth | |
| blockHeight | |
| nlevel1 | |
| cmap | |
| orientation | |
| right | |
| cbarwidth | |
| cbarpad | |
| fixzoom | |
| fixrange | |
| filenameout | |
| clear | |
| fontsize | |
| fig_w | |
| fig_h | |
| dpi | |
| maxXticks | |
| maxYticks | |
| cbarticks | |
| edgecolor | |
| smooth | |
| xrange | |
| yrange | |
| figure | |
| ax | |
| value | |
| min | |
| max | |
| data | |
| viewXrange | |
| viewYrange | |
| valueClip | |
| xlist | |
| ylist | |
| xlistspecial | |
| ylistspecial | |
| cax | |
| cbar | |
| selection | |
As polyplot, but use regridded data to display.
Definition at line 336 of file amrplot.py.
| def amrplot.rgplot.show | ( | self, | |
var = None, |
|||
data = None, |
|||
min = None, |
|||
max = None, |
|||
reset = None, |
|||
fixrange = None, |
|||
filenameout = None |
|||
| ) |
Draw the plotting-window.
Definition at line 339 of file amrplot.py.
| amrplot.rgplot.ax |
Definition at line 348 of file amrplot.py.
| amrplot.rgplot.filenameout |
Definition at line 434 of file amrplot.py.
| amrplot.rgplot.fixzoom |
Definition at line 352 of file amrplot.py.
| amrplot.rgplot.image |
Definition at line 392 of file amrplot.py.
| amrplot.rgplot.swap |
Definition at line 374 of file amrplot.py.
| amrplot.rgplot.valueClip |
Definition at line 365 of file amrplot.py.
| amrplot.rgplot.viewXrange |
Definition at line 345 of file amrplot.py.
| amrplot.rgplot.viewYrange |
Definition at line 346 of file amrplot.py.
 1.8.13